
Data current as of January 9, 2026.
MP Materials (NYSE: MP) Decode: Rare Earths, National Security Narratives, and What the Data Actually Supports
Every market cycle needs a strategic resource.
As of early January 2026, rare earths have re-entered the market narrative — and MP Materials is back at the center of it.
The pitch is familiar:
“Follow the money — especially when strategic industries and government power are involved.”
But narratives compress complexity. Our job at MarketInsiderLab is to decode what’s being implied, show what’s verifiable in filings and positioning data, and make the risk reality clear.
1. What the MP Rare Earth “Strategic” Narrative Is Claiming
The rare earth pitch typically runs like this:
- Rare earth magnets are critical for defense systems, EVs, and advanced manufacturing.
- China dominates processing capacity and large parts of the supply chain.
- U.S. policy wants supply-chain independence and “friend-shoring.”
- Therefore, a U.S.-based rare earth platform becomes strategically inevitable.
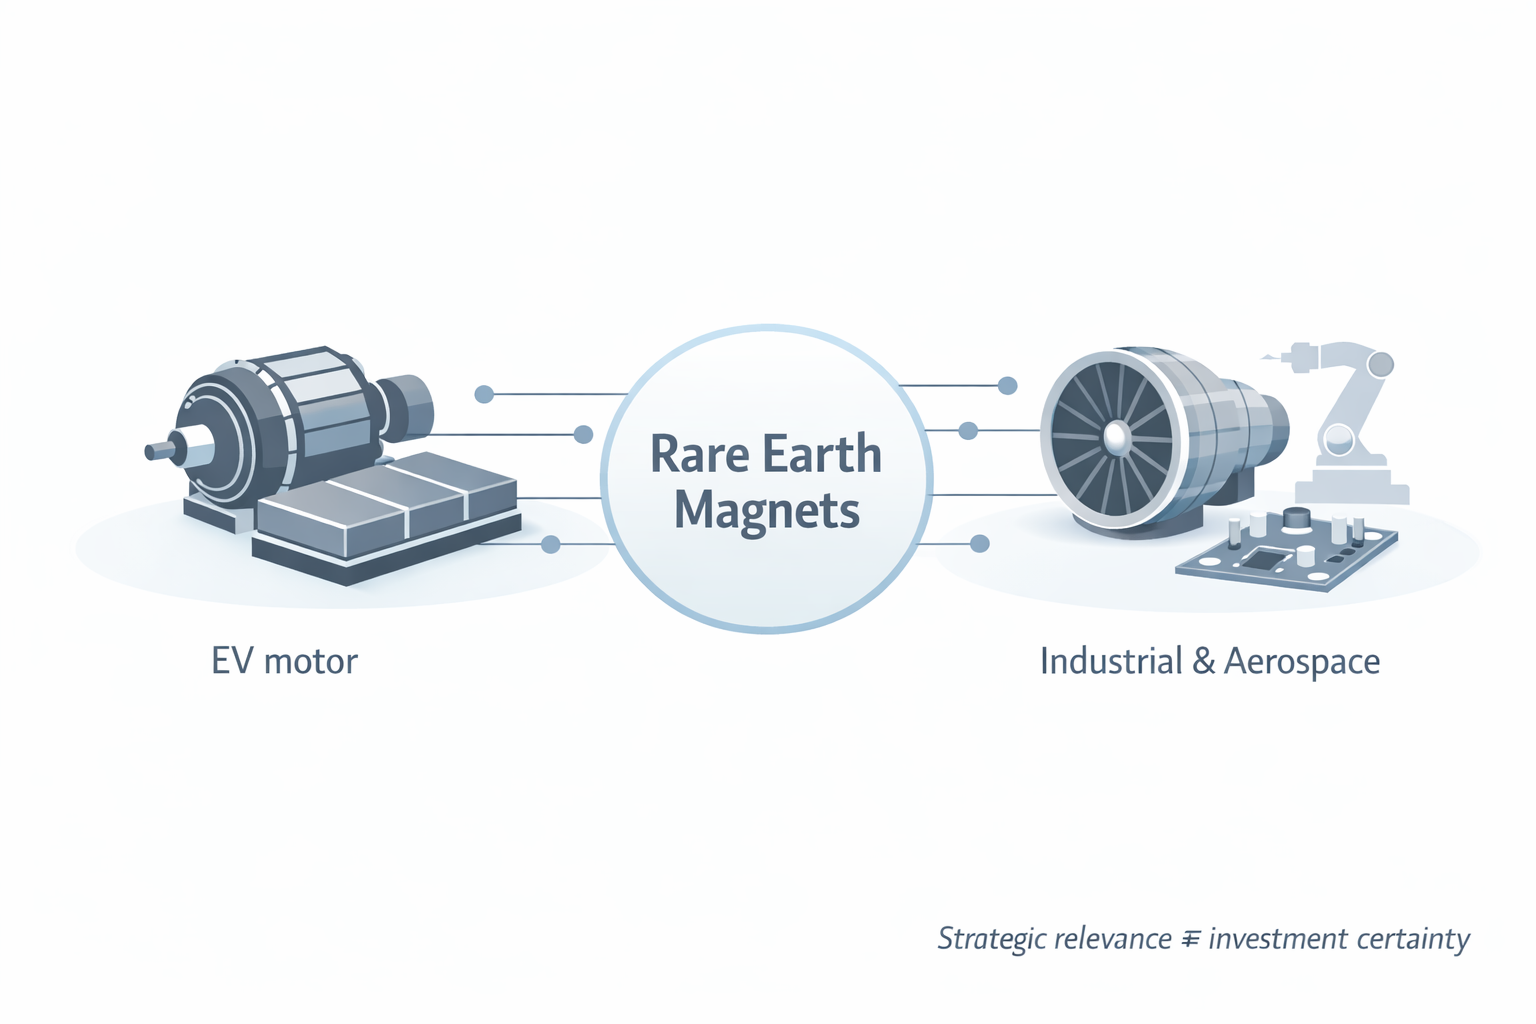
There’s truth in the strategic framing — but “strategic relevance” is not the same as “investment certainty.” In markets, it often becomes an excuse for valuation leaps and simplified thinking.
Critical minerals sit at the intersection of energy transition and military supply chains. The same inputs that support EV motors and wind turbines can also support defense platforms.
China currently dominates global production and processing of critical minerals — including a majority share of rare earth output — and has used export controls and licensing frameworks as part of its trade and industrial policy. That dynamic has reinforced concerns within U.S. policy circles about dependency risk and potential supply disruptions, particularly for defense- and technology-linked inputs.
2. The Company Most Promotions Are Pointing To
Many recent rare earth and “strategic minerals” promotions are no longer subtle.
Across both paid teasers and mainstream commentary, the clues consistently converge on
one clear company.
- Operates the only scaled rare earth mine in the U.S. (Mountain Pass, California)
- Pushes vertical integration into magnet manufacturing
- Has notable U.S. government and industrial counterparties mentioned in public coverage
3. Why MP Is Back in Focus (Early 2026 Context)
Timing matters. MP’s renewed attention has been reinforced by:
- Ongoing supply-chain “security” policy framing in Washington
- Broader critical minerals investment flows
- A steady drumbeat of geopolitical risk headlines that make “domestic sourcing” emotionally persuasive
Important discipline: if a thesis depends on current-event headlines, it can change quickly. A strong decode keeps the focus on what persists: contracts, financing structure, production execution, and balance-sheet realities.
4. Institutional Ownership: Follow the Filings — With Reporting-Lag Discipline
This matters because many readers assume ownership tables are “live.” They are not. They’re a blend of:
- quarterly filings (lagged),
- platform refresh cycles (sometimes inconsistent), and
- entity mapping issues (the same holder can appear in multiple forms).
4.1. Institutional Ownership: Follow the Filings
Institutional ownership in MP Materials is often cited as evidence of conviction.
That data is useful — but only when read with proper reporting-lag discipline.
Top 5 MP Institutional Owners (13F-based snapshot)
Report period: Sep 30, 2025 Filed/Reported in Nov 2025
| Investor | Shares | Change in Shares |
|---|---|---|
|
Hancock Prospecting Pty Ltd Report Period: Sep 30, 2025 |
14,861,212 | +1,000,000 (+7.21%) |
|
Vanguard Group Inc Report Period: Sep 30, 2025 |
14,020,574 | +363,975 (+2.67%) |
|
BlackRock, Inc. Report Period: Sep 30, 2025 |
12,694,298 | -2,092,032 (-14.15%) |
|
State Street Corp Report Period: Sep 30, 2025 |
5,828,368 | -679,340 (-10.44%) |
|
Morgan Stanley Report Period: Sep 30, 2025 |
3,829,891 | -189,614 (-4.72%) |
plus platform refresh timing and entity mapping. Use the report period and
reported date as the anchor for interpretation.
5. The DoD–MP Structure: Strategic Relevance and Structural Complexity
Institutional commentary has also emphasized how unusual the DoD–MP arrangement actually was. In an October 2025 retrospective, J.P. Morgan — which acted as sole financial advisor and lead arranger — described the transaction as a first-of-its-kind public-private partnership with no established blueprint, combining equity investment, long-duration offtake structures, and project-based financing. Importantly, JPM framed the deal not as a guarantee of outcomes, but as a potential template for future national-security-linked industries — underscoring both MP’s strategic relevance and the execution complexity embedded in the structure.
Why this matters for investors: a complex structure can be strategically positive while still embedding operational and financial execution risk. The “strategic” label can lift sentiment; it does not eliminate timeline, buildout, or margin risk.
6. Derivatives Positioning: Signal, Hedge, or Dealer Plumbing?
Options data can be useful — but only when framed correctly.
By January 9, 2026, the most visible “institutional options” snapshots are still largely anchored to Q3 2025 filings (report period: Sep 30, 2025, reported through November 2025). That means the table below is best used as a structure read — not a live sentiment meter.
What matters is the shape of positioning: large call and put totals can reflect:
- directional speculation,
- delta-hedged strategies,
- dealer positioning and inventory management,
- or hedges layered on top of underlying equity exposure.
Practical takeaway: If a teaser claims “unusual call buying = certainty,” it’s usually overstating the edge. When major names appear with both large calls and large puts, your base case should be structured / hedged exposure — not prophecy.
| Holder | Side | Underlying Shares | Change | Market Value | Report Period | Reported |
|---|---|---|---|---|---|---|
| UBS Group AG | Call | 6,944,670 | +68,590 (+1.00%) | $465.78M | Sep 30, 2025 | Nov 13, 2025 |
| Susquehanna International Group | Call | 5,366,900 | +226,200 (+4.40%) | $359.96M | Sep 30, 2025 | Nov 14, 2025 |
| Squarepoint Ops LLC | Put | 4,738,300 | +628,000 (+15.28%) | $317.80M | Sep 30, 2025 | Nov 14, 2025 |
| Citadel Advisors LLC | Put | 3,852,200 | +3,126,400 (+430.75%) | $258.37M | Sep 30, 2025 | Nov 14, 2025 |
| Citadel Advisors LLC | Call | 3,496,500 | +2,893,400 (+479.75%) | $234.51M | Sep 30, 2025 | Nov 14, 2025 |
| Jane Street Group, LLC | Put | 3,131,200 | +2,461,300 (+367.41%) | $210.01M | Sep 30, 2025 | Nov 14, 2025 |
| Jane Street Group, LLC | Call | 2,477,200 | +589,200 (+31.21%) | $166.15M | Sep 30, 2025 | Nov 14, 2025 |
| Susquehanna International Group | Put | 2,348,000 | +288,500 (+14.01%) | $157.48M | Sep 30, 2025 | Nov 14, 2025 |
| Tidal Investments LLC | Put | 1,600,000 | +1,600,000 | $107.31M | Sep 30, 2025 | Nov 14, 2025 |
| Parallax Volatility Advisers, L.P. | Put | 1,395,700 | — | $93.61M | Sep 30, 2025 | Nov 14, 2025 |
7. Insider Activity: Evaluate the Pattern, Not the Headline
Teaser promotions often glide past insider behavior because it complicates the “inevitability” story.
But for narrative-driven stocks, insider flow is a useful tension indicator.
Insider selling does not automatically mean “bad.” Executives sell for many reasons
(taxes, diversification, option exercises).
But when selling is persistent while the public narrative becomes more certain,
the correct posture is to assume complexity and demand proof through execution.
Below is a quick, reader-friendly snapshot of the insider activity you provided.
Use it as a pattern check — not as a standalone buy/sell signal.
Insider pattern (2025 filings shown)
Mostly selling
Recent insider prints skew heavily toward sales, not accumulation.
CEO sales (shown)
~3.02M shares
James H. Litinsky sales across 2025 entries provided.
C-suite sales (shown)
CFO ~133K • COO ~150K
CFO Ryan Corbett and COO Michael Rosenthal sales in 2025 entries provided.
How to read this:
Insider selling is not automatically bearish (taxes, diversification, 10b5-1 plans),
but in a “strategic narrative” stock it’s a useful tension indicator —
especially when public excitement is rising.
Data note:
Totals above are calculated from the transaction lines you provided
(not a full EDGAR reconstruction). Use as “pattern context,” not a definitive audit.
| Insider | Role | Type | Shares | Price | Date | Reported |
|---|---|---|---|---|---|---|
| Corbett Ryan | Chief Financial Officer | Sale | 38,146 | $60.00 | Dec 09, 2025 | Dec 10, 2025 |
| Litinsky James H. | Chairman & CEO | Sale | 74,638 | $63.42 | Dec 05, 2025 | Dec 05, 2025 |
| Litinsky James H. | Chairman & CEO | Sale | 34,801 | $63.11 | Dec 05, 2025 | Dec 05, 2025 |
| Litinsky James H. | Chairman & CEO | Sale | 275,561 | $62.79 | Dec 05, 2025 | Dec 05, 2025 |
| Litinsky James H. | Chairman & CEO | Sale | 207,691 | $63.72 | Nov 20, 2025 | Nov 20, 2025 |
Interpretation:
This table is not “proof of bearishness.”
It’s a credibility check against the inevitability narrative:
insiders are monetizing exposure while the market prices in strategic upside.
8. Fundamentals Reality Check: Strategy ≠ Margin Stability
Rare earth narratives often compress complexity into one line: “government-backed strategic winner.”
A stronger decode keeps returning to the fundamentals that actually drive outcomes:
- Execution: building and scaling processing/magnet capacity is hard.
- Costs: capex and operating complexity can pressure margins.
- Pricing: rare earth pricing can be volatile and policy-sensitive.
- Time: strategic projects often take longer than promotional timelines imply.
Below are two clean, front-end-friendly visuals derived from third-party financial data through Q2 2025.
These are the kinds of numbers “strategic” promos often skip — because they add nuance.
Fundamentals Reality Check Quarterly
Two numbers promotions rarely show together: net income and free cash flow.
Data below is through Q2 2025.
| Fiscal Period | Revenue | Net Income | Free Cash Flow |
|---|---|---|---|
|
Q2 2025
Ended Jun 30, 2025
|
$51.98M | -$30.87M | -$32.66M |
|
Q1 2025
Ended Mar 31, 2025
|
$53.20M | -$22.65M | -$187.33M |
|
Q4 2024
Ended Dec 31, 2024
|
— | -$65.42M | -$184.24M |
|
Q3 2024
Ended Sep 30, 2024
|
— | -$25.52M | -$53.29M |
|
Q2 2024
Ended Jun 30, 2024
|
$24.51M | -$34.06M | -$15.65M |
Decode lens: “strategic” ≠ “self-funding”
Why this matters for a teaser decode: A “national security” narrative can be true while the
investment profile remains cyclical, capital-heavy, and execution-sensitive.
Data note: Revenue figures are sourced from a third-party financial data feed.
Some quarters show incomplete line-item coverage (e.g., missing non-interest income),
which can cause “Total Revenue” to appear distorted.
Where coverage is incomplete, revenue is shown as “—”.
Net income reflects reported bottom-line results.
Cash vs Debt Snapshot Balance Sheet
A quick visual of liquidity vs leverage. Bars are scaled within this table (not to market cap).
Data through Q2 2025.
| Fiscal Period | Cash & Equivalents | Long-Term Debt |
|---|---|---|
|
Q2 2025
Jun 30, 2025
|
||
|
Q1 2025
Mar 31, 2025
|
||
|
Q4 2024
Dec 31, 2024
|
||
|
Q3 2024
Sep 30, 2024
|
||
|
Q2 2024
Jun 30, 2024
|
Decode implication: Leverage staying structurally above cash is one reason sophisticated holders
use hedges and options structures. It’s not “mysterious smart money” — it’s often risk management.
9. Myth vs Reality (The Decode)
10. MarketInsiderLab Verdict (Jan 2026)
As of January 2026, MP Materials remains a strategically important company — but a strategically complicated investment.
FAQ
Is MP Materials a “government-backed” stock?
MP has been discussed in policy and institutional contexts as strategically relevant, and certain arrangements have been described as unusually structured. But “government-linked” does not mean “risk-free,” and it does not eliminate execution or margin risk.
Does options activity mean “smart money” knows something?
Not reliably. Options positioning can be hedging, volatility trading, market-making inventory, or short-term speculation. A decode should interpret options flow with context, not certainty.
Why do ownership tables disagree across platforms?
Most ownership tables are built on lagged filings and refreshed on different schedules. They can also split one holder across multiple related entities. Always prioritize tables that show the report period and filed date.
Disclosure: This article is for informational purposes only and does not constitute investment advice. We reference public reporting and third-party platforms that may contain delays or inconsistencies. Always verify primary sources.