
This guide explains how to read trading volume by focusing on participation, conviction, and exhaustion — not prediction, indicators, or trading signals.
1. Why Volume Exists on Every Chart — And Why It’s Misread
Volume is printed beneath price on most charting platforms, which makes it feel like it must be a “signal.”
In practice, volume is one of the easiest features on a chart to misunderstand — not because it is complex,
but because people ask it the wrong question.
Volume does not tell you what will happen next. It does not “confirm” a prediction. It does not identify smart money.
What volume can do is far more useful: it shows whether a move happened with broad participation or relative indifference.
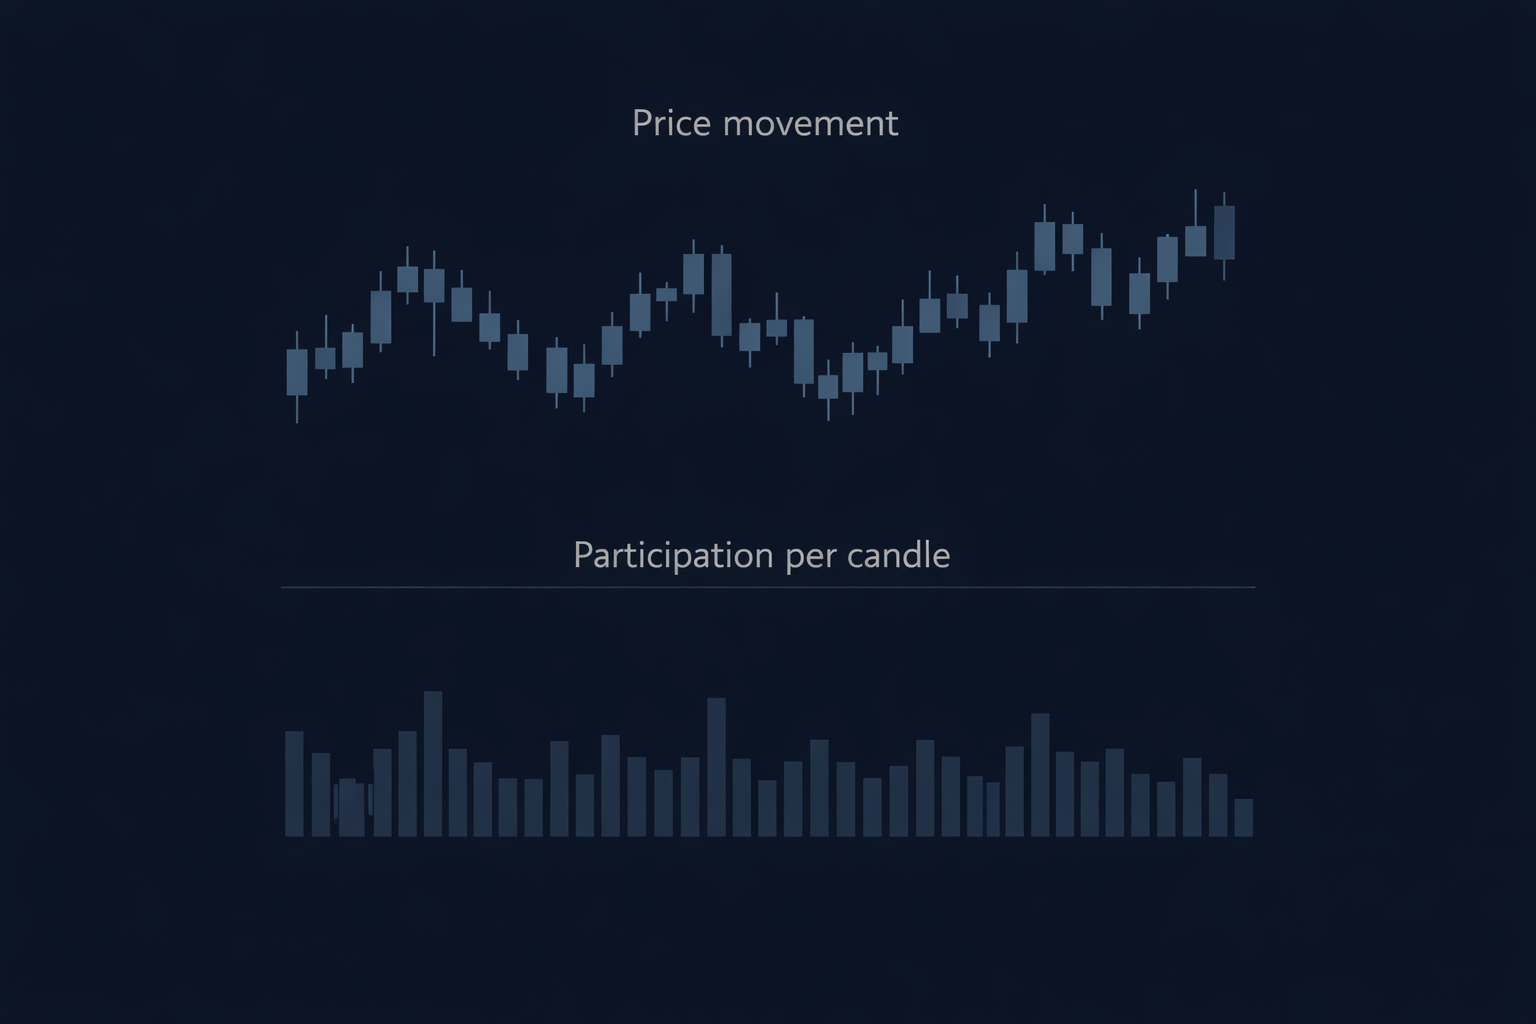
A simple way to think about it is this: price records movement, while volume records how many participants were involved in producing that movement. When you ignore volume entirely, you often end up describing the market as if it moved in a vacuum.
This distinction becomes much clearer once price behavior itself is understood structurally — which is why foundational chart literacy is a prerequisite for interpreting volume without distortion.
2. What Volume Actually Measures (And What It Doesn’t)
At a basic level, volume is the number of shares (or contracts) that changed hands during a time period.
Each bar represents the total activity inside that candle or interval — whether the period ended up green or red.
This is where many people go wrong: they treat volume as if it measures “buying” or “selling.”
It does not. A transaction only occurs when buyers and sellers meet. Volume measures that meeting.
Volume also does not tell you the quality of participation. High volume can occur because of long-term investors,
short-term speculators, hedging flows, rebalancing, forced selling, options-related positioning, or simple news-driven attention.
The bar itself does not label the motive.
In other words: volume measures activity, not correctness — and not intent.
3. Volume as Context, Not Confirmation
You will often hear the phrase “volume confirms price.” The problem is that it is usually said as if volume has a single meaning.
In reality, volume only becomes informative once you define context: trend, range, timeframe, and where price is relative to prior structure.
The same volume profile can support different interpretations depending on what the market is trying to do.
A rise in volume can mean expanding interest, but it can also mean expanding disagreement — more participation can reflect conflict,
not consensus.
Consider three common relationships. Rising price with declining volume may indicate that the move is continuing, but with narrowing participation.
Falling price with stable volume may indicate persistent pressure without panic. Flat price with expanding volume may indicate increased two-sided trade
and a market negotiating value.
None of these patterns “predict.” They simply add evidence about participation.
Misunderstanding volume often follows the same logic error seen elsewhere in charting — treating descriptive tools as predictive rules — which is why structural guides are most useful when interpreted contextually rather than mechanically.
Volume is best understood as a context layer that helps you avoid over-reading price alone.
4. Participation vs Conviction
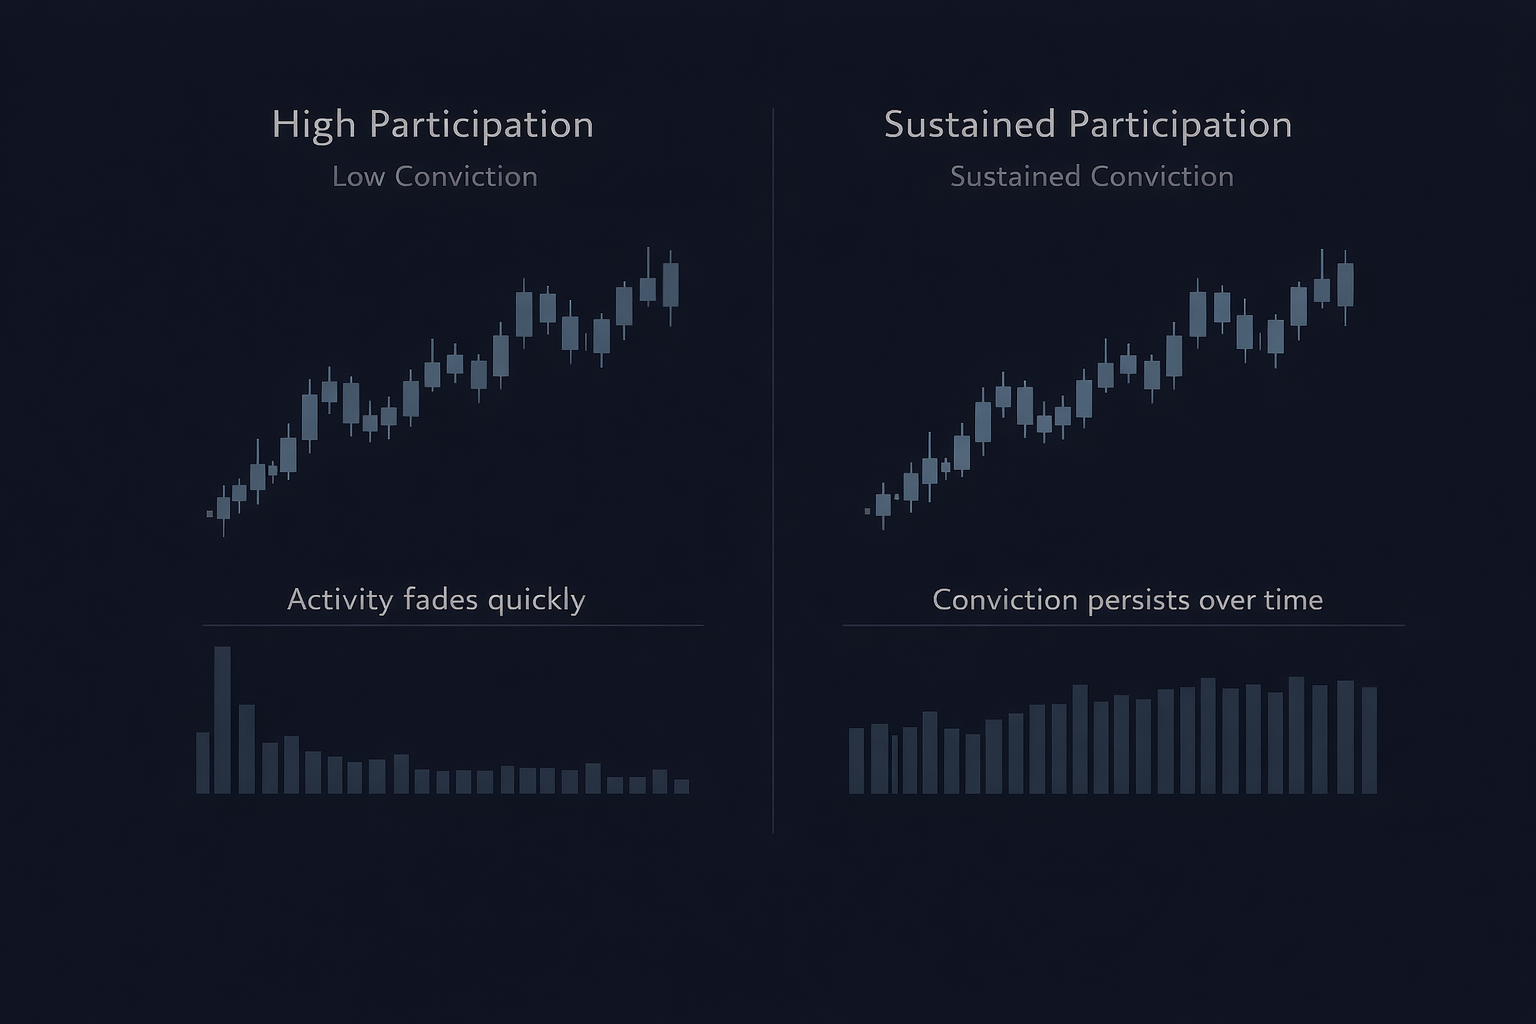
A useful distinction is the difference between participation and conviction. High participation means many transactions occurred.
Conviction implies something else: a willingness to keep acting in the same direction over time, despite changing prices and uncertainty.
This is why “high volume = strong move” is not a reliable interpretation. High volume can appear at the beginning of a move,
during the middle of a trend, or near a turning point. The market can be highly active for reasons that have nothing to do with durable conviction.
If price is the story you can see, volume is the crowd noise behind it. Loud crowds can be supportive.
They can also be emotional, late, or unstable. Volume tells you how full the room is — not who is right.
5. Volume Peaks and Market Exhaustion
One of the most educational uses of volume is identifying exhaustion — not as a signal to trade, but as an explanation for why momentum fades.
Markets often require increasing participation to keep pushing in the same direction. When participation peaks, continuation can become harder.
Importantly, volume peaks are usually clearer in hindsight. A “climax” in activity can occur near major highs or lows, but it is not a clock.
It does not tell you the next candle. It simply reveals that a lot of transactions occurred at a moment when emotion and attention were elevated.
This is why volume is often better at explaining than predicting. It can clarify why a move struggled to continue, why a breakout failed, or why a decline accelerated. It provides a participation-based interpretation of the same price path.
6. Timeframe Matters More Than the Indicator
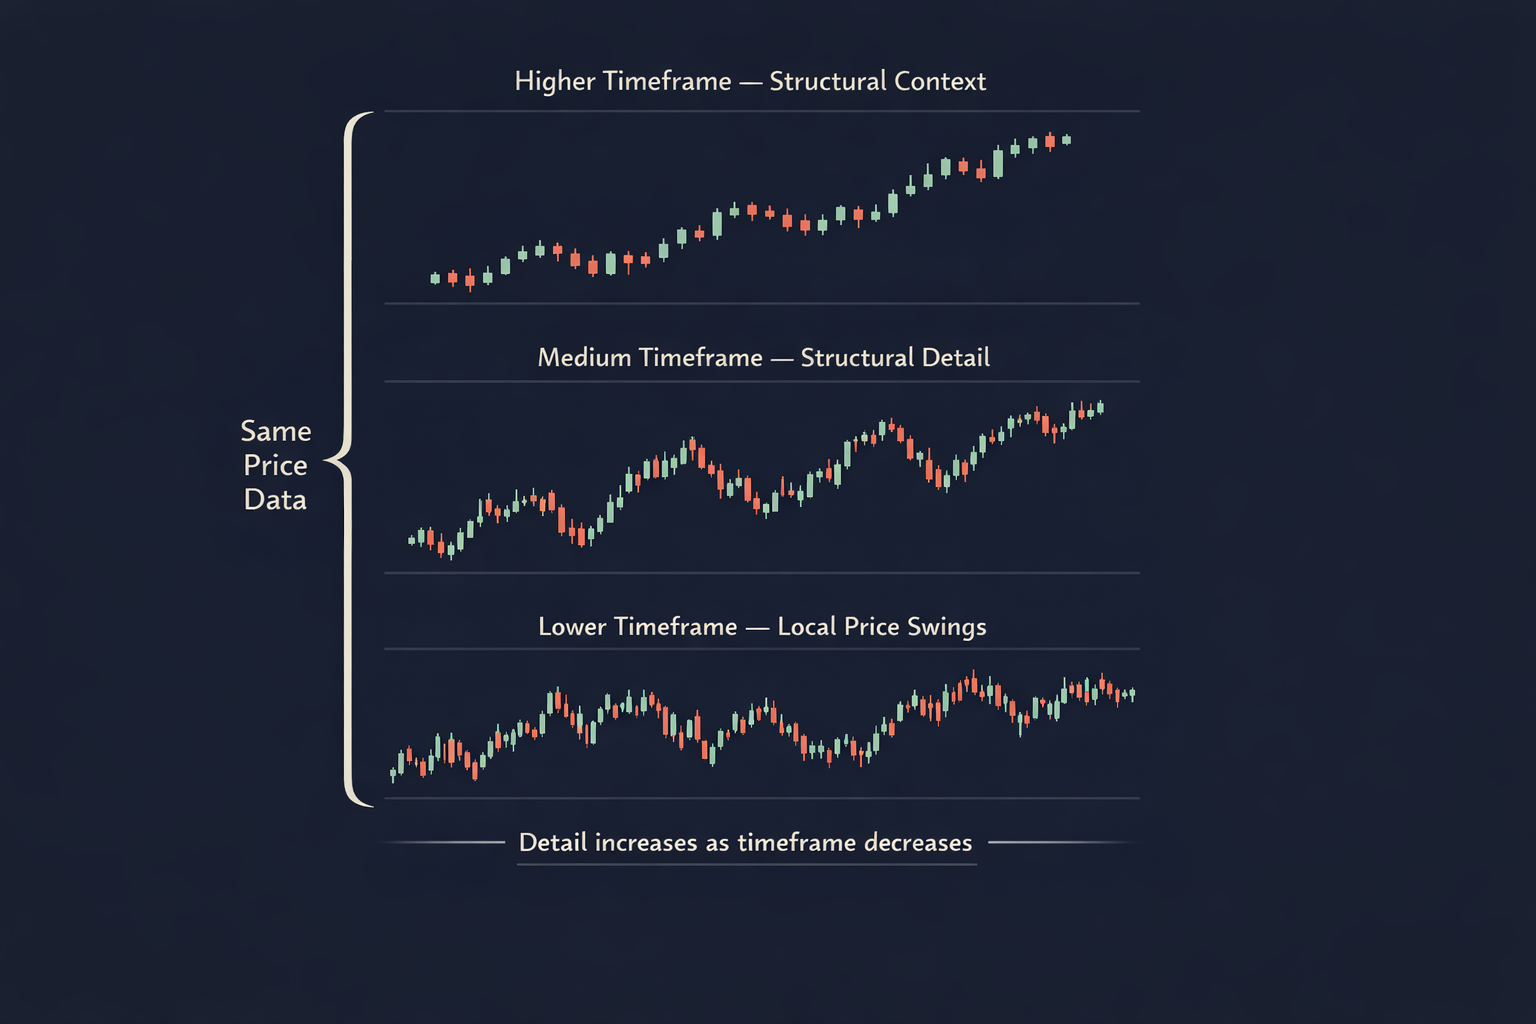
Volume is not a universal language across timeframes. A heavy volume day means something different on a five-minute chart than it does on a weekly chart.
Without timeframe, volume becomes a number without interpretation.
Short timeframes are dominated by microstructure, news bursts, and short-term positioning. Longer timeframes capture broader participation,
institutional rebalancing, and slower capital flows. The same “high volume” label can describe entirely different behaviors depending on scale.
The practical point is simple: always anchor volume to the timeframe you are studying.
A volume spike should be compared to what is normal on that chart — not to an abstract idea of what “high” means.
7. Reading Volume on a TradingView Chart
On most TradingView charts, volume appears as a histogram beneath price.
Each vertical bar represents the total number of shares or contracts traded during the corresponding candle above it.
The height of the bar reflects activity — not direction.
By default, volume bars are colored to match the candle they belong to.
This coloring is cosmetic. A green volume bar does not mean buying dominated,
and a red bar does not mean selling dominated. Every transaction requires both sides.
The color only reflects where the candle closed relative to its open.
What matters is how volume behaves relative to itself over time.
Because of this, interpretation depends less on indicators and more on how the chart is configured — which is why clean setup and scale awareness
matter before drawing conclusions from volume behavior.
A bar is only meaningful when compared to what is typical on that chart and timeframe.
Zooming in or out will change what looks “large” or “small” because the reference point shifts.
When reading volume on TradingView, focus on relationships rather than absolutes.
Ask whether participation expanded or contracted as price moved,
whether activity clustered around certain levels,
and whether interest appeared to build, fade, or peak during the move.
This approach treats TradingView as a visualization tool, not a decision engine.
The platform shows you participation. Interpretation still depends on structure,
timeframe, and context — not on settings or indicators.
8. Why Indicators Don’t Fix Volume Misunderstanding
Many traders respond to confusion by adding derived indicators: on-balance volume, volume oscillators, accumulation/distribution, and more.
These tools can be interesting, but they do not solve the core problem. They inherit the same limitations as raw volume.
If you treat volume as a prediction engine, adding formulas will not make it one.
Most “volume indicators” simply reshape the same data into a new line — which can create a false sense of precision without improving interpretation.
For educational chart literacy, raw volume is usually sufficient. The skill is not in the tool.
The skill is in asking the right question: what does this level of participation imply about agreement, friction, or exhaustion in this context?
9. How Volume Completes Chart Literacy
Price tells you what happened. Scale influences what your eye perceives. Volume adds the missing dimension: participation.
Without volume, you can describe movement but miss the intensity of engagement behind it.
This is why volume fits naturally after learning basic chart structure. Once you can read price behavior without chasing signals,
volume helps you separate moves that occurred with broad participation from moves that occurred with thinner engagement.
Over time, this changes how you interpret narratives. Big stories often spread after participation has already peaked.
Volume does not invalidate stories, but it can constrain them by showing where attention concentrated — and where it did not.
10. What Volume Cannot Tell You (And Never Will)
To use volume well, you need clear boundaries. Volume cannot reveal intent. It cannot label smart money.
It cannot guarantee continuation or reversal. It cannot predict the future path of price.
What volume can do is more grounded: it can show when participation expanded, when it faded, and when it reached extremes.
It can help you identify crowding, two-sided conflict, and exhaustion — as interpretive context, not as a trigger.
If you treat volume as evidence rather than prophecy, it becomes one of the cleanest tools for reading markets with less distortion.
It will not make you faster. It will make you harder to mislead.
Conclusion: Volume as Evidence, Not Instruction
Learning to read volume does not give you an edge through prediction. It gives you clarity through evidence.
Volume shows whether a price move occurred with broad participation, narrow engagement, or visible exhaustion.
When combined with price structure and proper scaling, volume completes chart literacy by adding the missing behavioral dimension.
It explains why some moves persist, why others stall, and why narratives often outlive the participation that originally supported them.
Used correctly, volume will not make analysis faster or louder. It makes it more grounded.
And grounded interpretation is harder to mislead than confident prediction.